
Full methodology can be found in this paper.
The data on this website was gathered from numerous primary data sources as well as from the knowledge of leading experts in California fish biology. We developed software called PISCES that helps us to standardize data in many formats – whether from a data table, spatial data, or information someone has in their head – and store it in a database for use in generating the species presence data you see on this site as well as for analysis at the Center for Watershed Science.
The resulting data from the software that we ultimately store indicates a species’ presence according to an expert, or primary source data, computer models, or suspected historical presence. Each of these types of presence is tracked separately so that we can analyze the quality of each data type, find data gaps, and focus conservation efforts.
Data Transformation
Data coming into the PISCES software does not conform to the way PISCES stores data. Understandably, the data sources we have gathered species presence data from have chosen to store their information in formats that are the most useful for them. As a result, PISCES needs to transform incoming data in order for it to be usable alongside the other data we collect.
In Geographic Information Systems (GIS) terms, most of these transformations are relatively simple:
- For spatial data: We reproject it, if needed, and spatially join it our watershed units (HUC 12s) in order to determine what watersheds can represent that data. PISCES then looks at each record, and determines the species that record represents, as well as the type of data (expert opinion, historic, etc).
- For tabular data (like excel files, etc) with coordinates: PISCES takes coordinates and generates spatial data points for each one along with the associated data. It can then use the same process as it uses for spatial data to determine the relevant information.
- For other types of data: Some data formats are spatial or tabular as above, but use obscure formats and styles to designate the information we need. In those cases, PISCES is extensible so that with the addition of some code, we can help it to understand the important information. We also need to be able to take information directly from the experts, so PISCES includes tools that connect to ArcGIS that let us select watersheds that represent a species’ range and add or remove them, along with relevant information, from the data for that species.
After bringing the data into PISCES, we sit down with experts again to make sure that data was not imported incorrectly, or problematic in any other way, and edit the distributions as appropriate.
Data Storage
PISCES stores data along with significant metadata, as well as with a full copy of the source data and relevant information about it. This method of storage allows us to trace back any transformed data to the source data that generated it in order to check data quality. Additionally, HUC 12 watersheds are an imperfect unit for mapping fish species. Should another, better unit come along that represents fish species distributions in a better way, we can adapt PISCES to use those units based upon the primary source data.
Mapping and Data Export
The PISCES software automatically maps and exports data on fish species based upon preconfigured database queries. The PISCES mapping utility can automatically map any data we have that results in watershed areas and optional attributes, whether or not it’s related to fish, based upon minimal configuration. For more information, see this poster from June, 2011.
PISCES Modeling
A unique aspect of PISCES is that it purposefully uses robust data architecture to capture the presence of a species, or even the probability of a species being present. By relying on either expert opinion, which can have subjective bias, or solely empirical observation, which suffers from both sample bias and incompleteness, the outcomes of our biogeographic mapping effort would be limited. Therefore, we intentionally included a ‘modeled’ presence, with corresponding probabilities if appropriate. The reason for this approach is two-fold: one, conservation efforts require that we reduce false negatives in our mapping of sensitive species, and two, it provides a check or validation on other data.
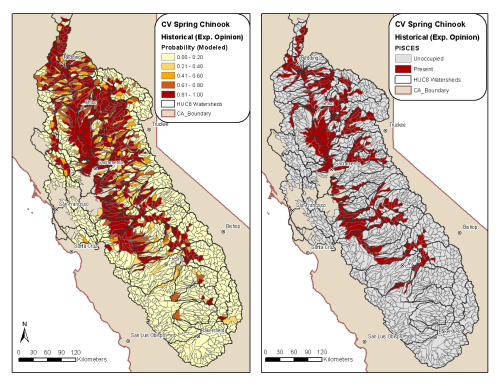
Effective species and habitat conservation requires that managers have access to spatially explicit information in order to prioritize conservation action in areas with the greatest potential for successful outcomes (e.g., recolonization, increases in biodiversity, long-term population stability). At present, there are few resources available to watershed managers that provide a taxonomic checklist or map of fish species – particularly sensitive species that require special management consideration – that should be included in management plans. Thus, in addition to providing expert opinion or actual observation from the field, our biogeographic modeling outcomes reflect environmental and anthropogenic variables that “predict” where a given species may occur. Predictive modeling can incorporate both current and future conditions to assign probability surfaces and thereby focus management decisions in areas where data are unavailable or uncertain. PISCES outputs combined with discriminant analysis (a classification technique used to maximize differences between groups and assign categories based on a given set of multivariates) can produce predictive fine-scale distribution maps. The following discriminant analyses illustrate the potential for predictive mapping and provide a framework for future conservation efforts.
To showcase the possibilities of using predictive mapping, 17 environmental and 5 anthropogenic variables were used to model 4 fish species for the Central Valley and west slope of the Sierra Nevada (a mapping domain of 1,504 HUC12s). The species selected for this pilot covered a range of environmental tolerances and life history strategies. Environmental variables were modeled in conjunction with the historical expert opinion dataset from PISCES, and environmental plus anthropogenic variables were modeled with the current expert opinion dataset. Models were then validated with observed data to see how accurately they predicted occupancy in HUCs with observed data.